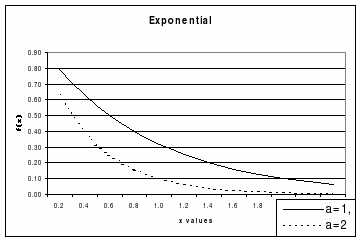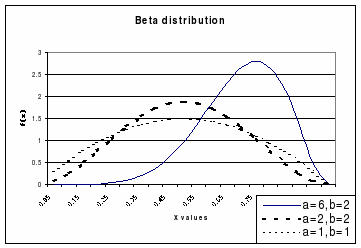
parameters: solid: a = 1, dotted a = 2
Frequency distributions are charts which show the frequency with which data values in a certain situation occur. A common example is the histogram (a type of bar chart). Usually, in a distribution the bars are omitted and just the outline of the distribution of values is shown. A simple, basic, distribution can be shown as follows, for the shoe sizes of a particular group of 64 men, each x representing one man.
| Size | frequency of occurrence | totals |
|---|---|---|
| 8 or smaller | x x x x x x x x x x x | = 11 |
| 8.5 | x x x x x x x x | = 8 |
| 9 | x x x x x x x x x x x x x x x | = 15 |
| 9.5 | x x x x x x x x x x x x x x | = 14 |
| 10 | x x x x x x x x | = 8 |
| 10.5 | x x x x x | = 5 |
| 11 | x x x | = 3 |
These curves are often referred to as probability distributions because the area bounded by the curve and specified, chosen, limits is equal to the probability of any value being between these limits. For instance, based on this sample, the probability of picking a man at random from this group and who takes size 10 to 11 inclusive is 16 chances in 64, or 0.25.


Some other, most typical, distributions in management are:
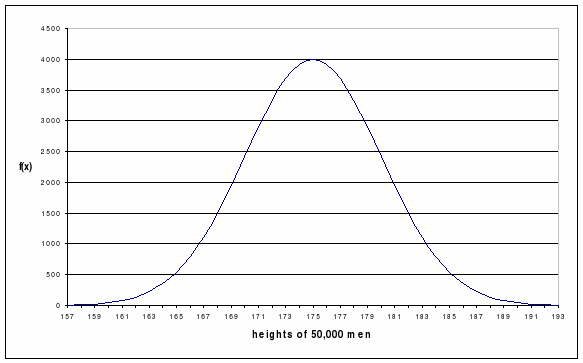
One well known and important frequency distribution much used in statistical analyses is the normal distribution, so called because it describes the way much of the data we use are distributed, particularly naturally occurring data. Such a graph is illustrated in Figure 3.
Suppose a random sample of 50,000 men was chosen from the population of the U.K. and their heights measured and the mean height of this sample of men was 175 cm. From experience we know that there are not many with a height of 150 cm and not many who are over 200 cm. If we plotted these heights as a graph it would start around 150 cm with very few men, rise to a point shown by 175 cm, which is the middle of the distribution of heights, (the mean) then fall off to around 200 cm.

heightsaxis. This defines the standard deviation.
In the normal distribution, the mean (what most people call the "average"), median (the middle value) and mode (the highest point) have all the same value, in this case 175cm. In theory, the width of the distribution is infinite, but in practice, of course, it has finite ends. One measure of spread of a normal distribution (in this case the heights) is the standard deviation, the distance from the mean to the point where the curve changes direction, i.e. from 170cm to 175cm, equal to 5cm. This only applies to the normal distribution, although the standard deviation is a measure of spread for any distribution, each having its own formula from which it can be calculated.
It is important to note that where these frequency distributions are used for estimating probability of events happening or not occurring, it is the area bounded by the curve and the limits chosen for the situation, and is not the height of the distribution. For example, referring to Figure 3 the probability that any man taken at random will be between 170 and 175 cm tall is the area bounded by the curve and the chosen limits of 170 and 175. From standard tables for the normal distribution, this area is approximately 34% or 0.34 of the whole area under the curve from left to right so the probability of this is 0.34. The actual number of men is 34% of 50,000 men or 17,000 approximately. The probability that any man at random will be smaller than 170 cm will be 50% - 34% = 16% approximately.
Frequency distributions are very useful for displaying data, for assessing probabilities and also for assessing statistical errors that occur as a result of sampling using small sample sizes.
