Definition & Uses
A flow chart is a graphical representation of a process using abbreviated descriptions of each step and various pictorial or geometrical symbols to categorise them.
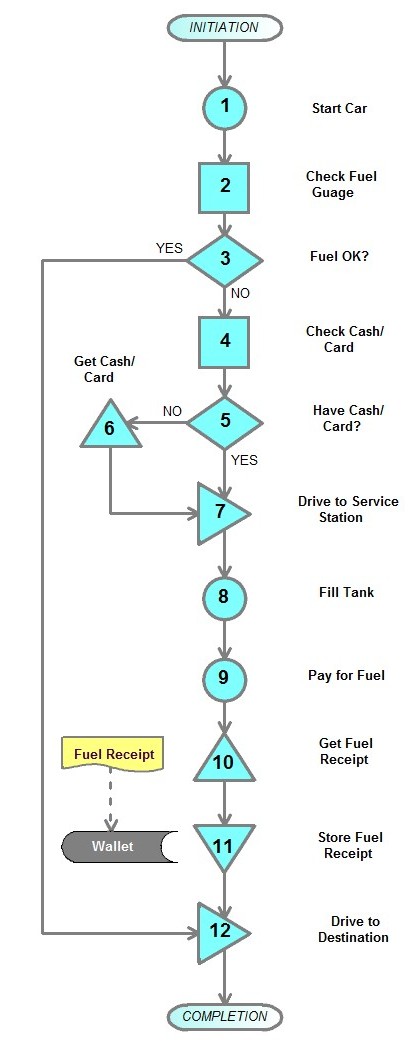
For example:
The focus is generally on the logic and value of the activities carried out, but can also be on either documents or materials involved. The word flow is sometimes replaced or supplemented by the words business or process. Recently the word charting has often been replaced by the word mapping. Commercial packages that can help you create a flowchart include Microsoft Visio, Smartdraw, iGrafx Flowcharter, Edraw Flowchart and Gliffy. Freeware packages include Diagram Designer, yEd and the drawing component of Open Office. A flowchart provides a simplified overview of the process. This overview allows the process steps and its underlying purpose to be reviewed away from the process location. Components of the process that do not add value can be identified and in particular, deficiencies, duplications and bottlenecks can be easier to recognise, and more effective alternatives can be developed. A flowchart can also be used for job evaluation, training and costing. In the past flowcharts have ofen been seen as an essential precursor to the application of work measurement and in particular PTMS. Now they are more commonly used in IT systems development and in Lean and Six Sigma projects.
Background
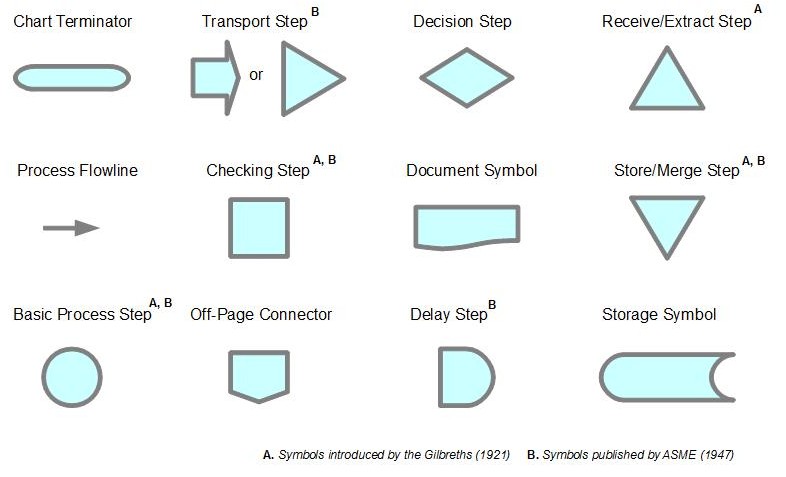
The basic concept is generally attributed to the husband and wife team of Frank and Lillian Gilbreth who first unveiled what they called a Process Chart in 1921 to the American Society of Mechanical Engineers (ASME). The Gilbreths used a wide range of symbols including 25 different symbols to cover inspection and checking. In 1947 ASME advocated a set of just five symbols (see below 'B').
From these simple foundations the practice of flowcharting has evolved and diverged. A key driver has been the advent from 1950s onwards of the information technology (IT) systems. Their focus on the movement and processing of data, has led to the evolution of data flow charts. A more recent development has been the use of process charts to map the flow of both materials and information in so-called value stream maps as part of Lean or Six Sigma methodologies. Data flow charts and Value Stream Maps are just two examples of the steadily widening range of flowcharting styles now in use. Each type has its own collection of symbols, boxes and representational rules. These charts are generally drawn from top to bottom of the page or else from left to right. The choice of symbols used is secondary to their clarity and consistency of application.
A common simplification is to replace all the symbols, apart from the diamond, with rectangular boxes containing the step summary. The example above shows how a selection of the available symbols (below) might be used to map a simple process.